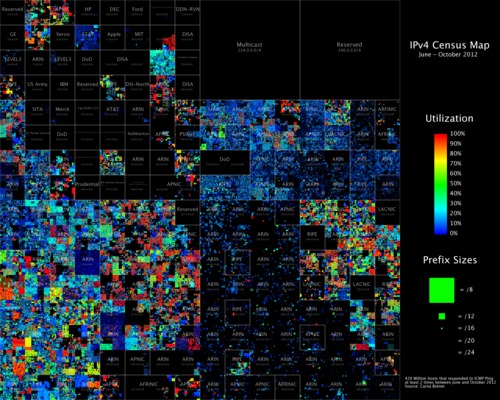
Figure 1: 2012 IPv4 Census Map, Hilbert Projection
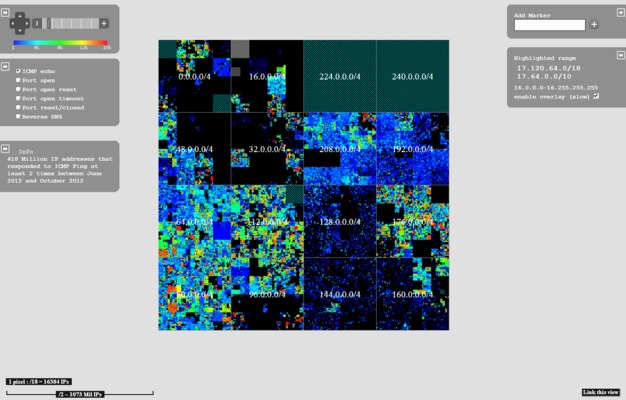
Figure 2: Browseable Hilbert map
Figure 1 shows 420 Million IP addresses that responded to ICMP ping requests at least two times between June and October 2012. The IP space is mapped to a 2-dimensional Hilbert Curve as inspired by xkcd. This curve keeps adjacent addresses physically near each other, and it is fractal, so we can zoom in or out to control detail. For an explanation how the data for this image was obtained, see Paper
This image as well as images that represent reverse DNS and portscan information are available as a Zoomable, Clickable map.
This Hilbert browser was originaly developed by ISI in their Internet mapping project [isi.edu]. We have modified it and added a few more features. The sourcecode for our version as well as code to generate image tiles is available at for download. We should mention that we are in no way associated to ISI or any researcher who worked at the ISI census project. We just took over the design for the Hilbert maps they made to have comparable images, as well as their Hilbert browser because it would have been a waste of time to code our own version.